Understand your mobile app's traffic statistics
Written by Dumè Siacci on
In your GoodBarber backend, you can find several types of usage statistics for your app.
In this post, we are going to review the traffic statistics (that you can find in the Audience > Statistics > Traffic menu). These stats will help you to measure the numbers of your app's readers, and their loyalty.
Here are some definitions, and some ways to analyze them.
Keep in mind that you can consult your stats specifically for iOS or Android, or for both platforms. You can also choose the time range to analyze.
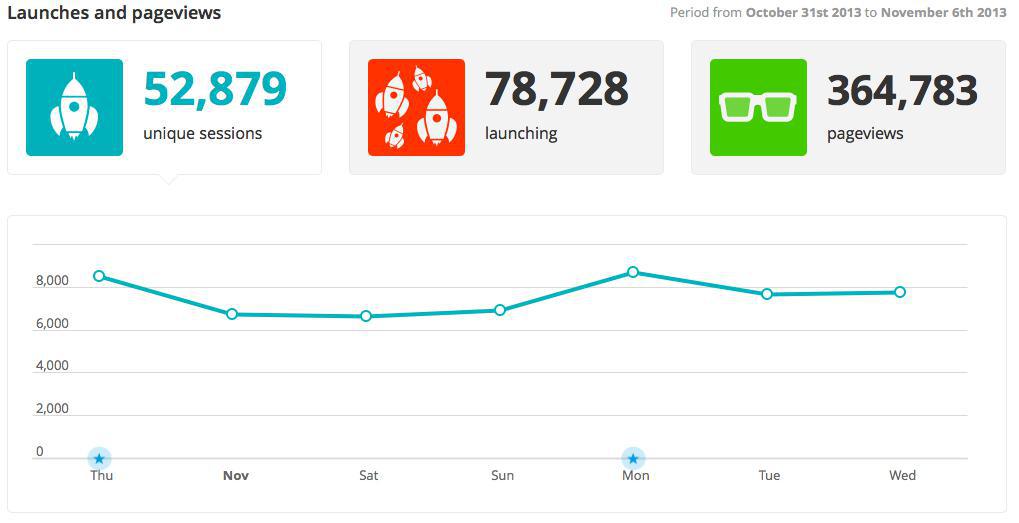
1. Unique sessions
An unique session is counted only one time a day per user. It means that if I launch your app several times the same day, I'll just show up one time in this stat.
2. Launching
A launching is counted every time an user launches your app, even if the app was active in multi-task. We can say that this stat is an effective total number of sessions in your app.
3. Pages views
A page view is counted every time a page is shown in your app. That means that if I open your app and read 4 articles in your Home section, 5 page views will be added to the total.
4. Download
That's logic: a download is counted every time an user installs your app on his phone.
5. Visit duration / Session time
The visit duration chart shows a repartition of the sessions time in your app. Of course, it means that the more your users make long sessions in your app, the more they are interested about your content.
6. Which informations analyze?
The launching / unique sessions ratio is an interesting insight. It will show if your users open your app several times a day or not.
You can also compare the number of pages views and the number of launching to obtain the average number of page views per session.
But I think that the most important is to compare the number of downloads with the number of unique sessions per day. By moving your mouse on the unique sessions chart, you'll see the daily number. For instance if my app is opened by 7,000 users daily, in average, and my number of download is around 40,000, it means that each day, 17% of my readers open the app.